When we ran our outreach agents on a 156-company target list, the system rejected 73% of prospects in the first pass. That cut wasted rep hours by more than half. The reason: we tracked the right lead qualification metrics, not just how many leads came in.
Most teams measure activity and outcomes. They miss the quality signals in between: the ones that expose funnel failures before a bad quarter locks in. Here are 10 KPIs, each with a formula, a benchmark, and a two-line fix. For the full framework picture, start with our lead qualification frameworks guide.
What Are Lead Qualification Metrics (and Why Most Teams Track the Wrong Ones)?
Lead qualification metrics are the KPIs that measure how effectively your sales team identifies prospects worth pursuing, tracking quality signals at each funnel stage rather than the volume of calls made or emails sent.
Only 7% of companies respond to a new lead within five minutes; the average is 42 hours, per 2024 B2B sales benchmarks by Gradient Works. An HBR study on lead response effectiveness found contacting a lead within the first hour made companies nearly 7x more likely to qualify them. Average B2B win rates have fallen to 17-20% (Winning by Design, 2023).
Two failure modes cause most of the damage. First: tracking activity instead of quality (calls measure effort, not fit). Second: tracking outcomes without leading indicators. By the time revenue drops, you have already spent 90 days in the wrong pipeline. For a primer on qualification stages and how MQLs, SQLs, and SALs differ, see our separate guide.
The 10 Lead Qualification Metrics Every Sales Team Should Track
Here are the 10 KPIs that cover the full qualification funnel, from first contact to closed deal. Track all 10 to locate where leads are leaking.
1. MQL-to-SQL Conversion Rate
MQL-to-SQL conversion rate measures the percentage of marketing-qualified leads that sales accepts as genuine opportunities in a given period.
Formula: (SQLs created / MQLs received) x 100
Benchmark: 16-20% for B2B, per Gradient Works benchmarks. The full range runs 12-38% depending on how MQLs are defined.
Below 12%: audit ICP criteria, marketing is passing unfit leads. Above 38%: sales is likely too permissive with SQL acceptance.
2. Lead Response Time (Speed to Lead)
Lead response time, or speed to lead, is the elapsed time between a prospect’s first conversion event and the first qualifying sales contact.
Formula: First Contact Date minus First Conversion Date
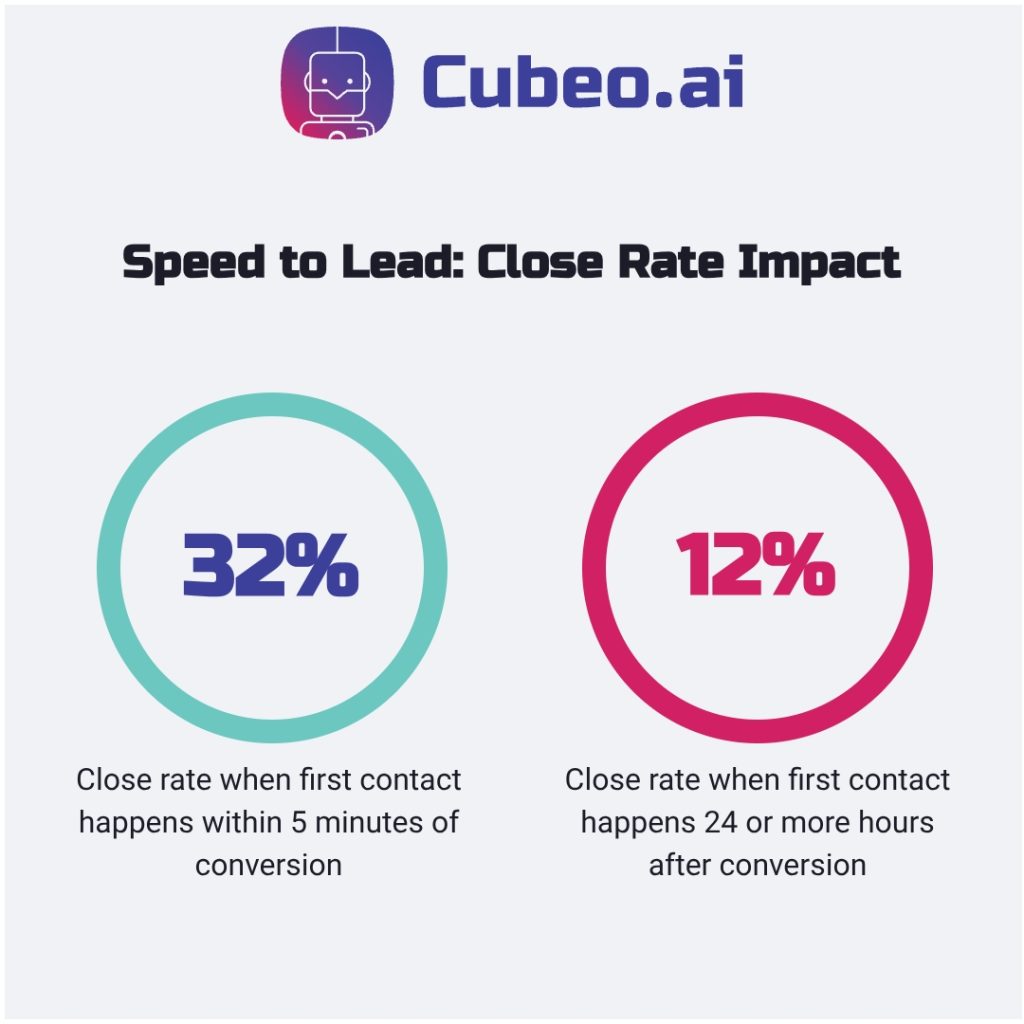
Benchmark: Under five minutes correlates with a 32% close rate versus 12% for 24+ hour responses, per response time data from Optif.ai.
This was the first metric we tuned on our 156-company list. Over 60 minutes: implement automated routing and instant rep alerts.
3. Lead-to-Opportunity Rate
Lead-to-opportunity rate is the percentage of all leads that convert to active sales opportunities, measuring how efficiently the top of the funnel feeds the pipeline.
Formula: (Opportunities created / Total leads) x 100
Benchmark: Lead-to-MQL runs 11-15% for many B2B teams; overall outbound lead-to-opportunity tends toward 5-10% (Gradient Works, 2024).
Low across all sources: ICP targeting is off. Outbound lags while inbound converts: audit targeting criteria upstream.
4. Lead Velocity Rate (LVR)
Lead Velocity Rate (LVR) is the month-over-month percentage growth in qualified leads, the leading indicator that predicts revenue momentum 2-3 quarters before it shows up in closed deals.
Formula: ((Qualified leads this month – Last month) / Last month) x 100
Benchmark: Positive LVR signals growth; target 10-20% MoM for a scaling team.
Two consecutive months of decline is a forward warning. Check top-of-funnel volume and ICP targeting before the quarter is gone.
5. Win Rate of Qualified Leads
Win rate of qualified leads measures the percentage of sales-qualified leads that convert to closed-won deals, revealing whether qualification criteria are actually selecting winnable opportunities.
Formula: (Closed-won deals / SQLs) x 100
Benchmark: Average B2B win rates sit at 17-20%, per Winning by Design’s 2023 GTM methodology. Well-qualified SQLs should reach 25-35%.
Win rate below benchmark with SQLs you consider solid: the problem is post-qualification (rep skill, pricing, competitive position), not the criteria.
6. Average Deal Size for Qualified Leads
Average deal size for qualified leads is the mean contract value of deals sourced from leads that passed your qualification criteria, a drift metric that signals when your ICP targeting is slipping.
Formula: Revenue from qualified-lead deals / Closed-won deals from qualified leads
Benchmark: Set your own baseline. Declining trend across two or three quarters means criteria are letting through smaller opportunities.
If shrinking: audit whether budget, authority, and need criteria are consistently applied during discovery.
7. Lead Score Distribution
Lead score distribution tracks the percentage of leads sitting in each score bucket at any point, a calibration signal that shows whether your scoring model is working or over-qualifying everything it sees.
Formula: Count of leads per score range (cold/warm/hot/qualified) as a percentage of total
Benchmark: Roughly 60-70% cold/warm, 20-25% hot, 5-10% qualified. If 40%+ score hot, the model is miscalibrated. Think of it like a thermostat: if everything reads hot, the sensor is broken.
Our Lead Scorer Agent handles automatic rescoring as new data arrives, but a RevOps owner must audit distribution monthly. Automated scoring routes leads; human judgment owns the qualification gate.
8. Enrichment Fill Rate
Enrichment fill rate measures the percentage of required firmographic and contact fields completed per lead record, the data-quality foundation that determines whether your scoring model has enough signal to work.
Formula: (Fields completed / Total required fields) x 100
Benchmark: 85-90%+ for primary fields (company size, industry, title, verified email). Below 70%, your scoring model runs on incomplete data.
Implement automated enrichment on all inbound leads. Flag records under 70% for manual review before allocating any rep time.
9. Disqualification Rate (and Reason Breakdown)
Disqualification rate measures the percentage of leads that enter the qualification funnel but are rejected, with a reason breakdown that shows exactly which ICP criteria are filtering most leads out.
Formula: (Disqualified leads / Total leads reviewed) x 100, segmented by rejection reason
Benchmark: 60-75% is healthy for tight ICP targeting. Our 156-company list hit 73%, confirming the criteria worked. Below 30%: criteria are probably too loose.
Review the top two rejection reasons each quarter. If “wrong company size” leads, update targeting before the next campaign.
10. Cost Per Qualified Lead (CPQL)
Cost per qualified lead (CPQL) is total spend (rep time, tooling, marketing) divided by the number of leads that pass your qualification criteria in a given period.
Formula: Total qualification spend / Qualified leads generated
Benchmark: Varies by channel and ACV. Track the trend: rising CPQL with flat qualified lead volume signals the process is getting more expensive without producing more output.
In the Dyver.ai deployment, token billing costs inflated per-contact spend silently. CPQL surfaced it first. Teams using automated prospecting workflows reduce CPQL by concentrating enrichment spend on high-fit accounts rather than enriching every record equally. Break it by channel to find your highest-cost source.
How to Build a Lead Qualification Scorecard in One Hour
A lead qualification scorecard consolidates all 10 qualification KPIs into a single table with RAG (Red/Amber/Green) thresholds, turning a weekly data review into a 10-minute diagnostic.
Copy this into your CRM or a shared spreadsheet. Thresholds are fully configurable without engineering. For the data-layer setup behind CRM-based metric tracking, operationalizing metrics into CRM fields from Winning by Design is the clearest reference. This approach aligns with Gartner’s guidance on RevOps measurement: a centralized source of truth for GTM metrics is the foundation of any measurement function.
| KPI | Formula | Benchmark | Status (RAG) | Cadence |
|---|---|---|---|---|
| MQL-to-SQL Rate | SQLs / MQLs x 100 | 16-20% | Green >16%, Amber 8-15%, Red <8% | Weekly |
| Lead Response Time | First contact – First conversion | <5 min ideal | Green <60min, Amber 1-4hr, Red >4hr | Daily |
| Lead-to-Opportunity Rate | Opps / Total leads x 100 | 5-10% outbound | Green >8%, Amber 4-7%, Red <4% | Weekly |
| Lead Velocity Rate | (This mo – Last mo) / Last mo x 100 | +10-20% MoM | Green >10%, Amber 0-9%, Red <0% | Monthly |
| Win Rate (Qualified) | Closed-won / SQLs x 100 | 25-35% for qualified | Green >25%, Amber 15-24%, Red <15% | Monthly |
| Avg Deal Size | Revenue from qual leads / # deals | Your baseline | Green stable/growing, Red >10% decline | Monthly |
| Lead Score Distribution | % in each bucket | 60-70% cold, 5-10% qualified | Green balanced, Red top bucket >40% | Monthly |
| Enrichment Fill Rate | Fields complete / Required x 100 | 85-90%+ | Green >85%, Amber 70-84%, Red <70% | Weekly |
| Disqualification Rate | Disqualified / Reviewed x 100 | 60-75% tight ICP | Green 60-75%, Amber <30% or >85% | Monthly |
| CPQL | Total qual spend / Qualified leads | Track trend | Green stable/falling, Red rising 2+ qtrs | Monthly |
Review leading indicators (LVR, response time, fill rate) weekly; review lagging indicators (win rate, deal size, CPQL) monthly. For HubSpot-specific setup, see our CRM enrichment guide.
Who Should Own Each Metric: SDR, Sales Manager, or RevOps?
Assigning clear ownership to each lead qualification metric prevents numbers from sitting in a dashboard nobody reads.
The fastest way to confirm no one acts on a metric is to make everyone responsible for it. According to the 2024 State of RevOps survey by RevOps Co-op, analytics and measurement reporting rank as the top ownership responsibility for RevOps teams.
| Role | Metrics Owned | Review Cadence |
|---|---|---|
| SDR | Lead Response Time, Enrichment Fill Rate, Disqualification Rate, Lead-to-Opportunity Rate | Daily / Weekly |
| Sales Manager | MQL-to-SQL Conversion Rate, Win Rate, Average Deal Size | Weekly / Monthly |
| RevOps | Lead Velocity Rate, Lead Score Distribution, CPQL | Monthly (with human audit) |
SDRs own operational metrics because they control the behaviors that move them. Sales Managers own pipeline health. RevOps owns system-level metrics that require structural changes when they drift.
One note on the RevOps row: LVR and score distribution can be monitored automatically. The monthly human review is still non-negotiable. Automated scoring routes leads; human judgment owns the gate. For stage-specific qualification KPIs by funnel stage, see our prospecting guide.
Key Takeaways
Lead qualification metrics are the difference between a pipeline that looks healthy and one that actually closes.
- Most teams track activity (calls, emails, meetings) rather than quality signals. The 10 metrics here measure whether each funnel stage is working.
- MQL-to-SQL benchmark: 16-20% for B2B (Gradient Works, 2024). Speed to lead under five minutes correlates with a 32% close rate versus 12% for 24-hour contact (Optif.ai, 2024).
- A 10-metric scorecard with RAG thresholds replaces 10 separate CRM reports, giving every stakeholder the same view in 10 minutes per week.
- Three ownership layers (SDR, Sales Manager, RevOps) with defined cadences prevent metrics from being everyone’s concern and nobody’s priority.
Frequently Asked Questions
What is a good MQL-to-SQL conversion rate?
A good MQL-to-SQL conversion rate for B2B companies is between 16% and 20%, based on Winning by Design’s 2023 GTM benchmarks. Published ranges vary from 12% in tighter studies to 38% in more permissive definitions, because companies define MQLs differently. Track your rate against your own quarterly baseline first; use 16-20% as a directional target, not a hard rule.
How do you calculate lead velocity rate?
Lead Velocity Rate (LVR) = ((Qualified leads this month minus Qualified leads last month) divided by Qualified leads last month) times 100. A positive LVR signals that your qualified pipeline is growing. Target 10-20% month-over-month growth for a scaling B2B team. A declining LVR is a forward warning to investigate top-of-funnel volume and ICP targeting before the quarter closes.
What are the key metrics for lead qualification?
The 10 key lead qualification metrics are: MQL-to-SQL conversion rate, lead response time, lead-to-opportunity rate, lead velocity rate, win rate of qualified leads, average deal size, lead score distribution, enrichment fill rate, disqualification rate, and cost per qualified lead. Together, these KPIs cover every stage of the qualification funnel from first contact to closed deal.
How do you measure lead quality in a CRM?
To measure lead quality in a CRM, track four core properties: lead score, enrichment fill rate, first response time, and MQL-to-SQL conversion rate. Most CRMs support native analytics for response time and custom properties for MQL stage tracking and score bucket reporting. Run a weekly fill-rate audit on new leads and a monthly MQL-to-SQL report to catch quality drift before it becomes a pipeline problem.