Get budget-ready workforce data that justifies your AI strategy decisions. This analysis delivers 30 source-verified statistics from BLS, PwC, and Pew Research that you can use immediately to set hiring priorities, reskilling budgets, and pilot timelines.
• Capture the $7.1 trillion revenue opportunity — Workers with AI skills earn 56% wage premiums while companies in AI-exposed industries see 3x faster revenue growth per employee
• Target your reskilling investments strategically — Female workers face 4.7% AI exposure versus 2.4% for males, and early-career tech workers declined 13% since 2022, showing exactly where to focus support programs
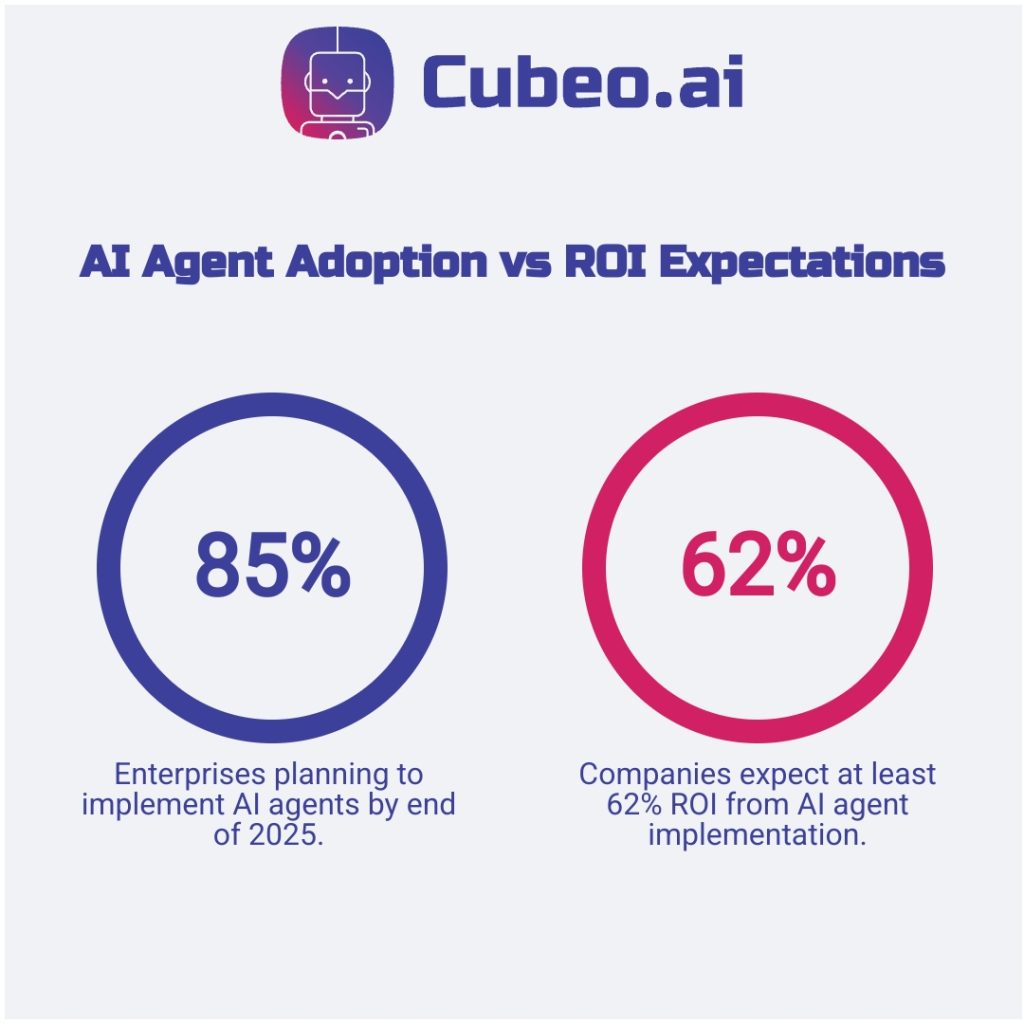
• Scale with proven ROI frameworks — Real implementations show 94% operational time reductions, with 85% of enterprises planning AI agent deployment by end of 2025 expecting 62% returns or higher
• Use government projections for realistic planning — BLS data reveals software developers will grow 17.9% through 2033 while claims adjusters decline 4.4%, giving you specific roles to prioritize for hiring versus automation
Each statistic includes collection dates, sources, and a one-line “so what” you can act on today, plus a complete 90-day pilot framework with success metrics and budget allocation guidance.
Global AI Impact and Key Definitions
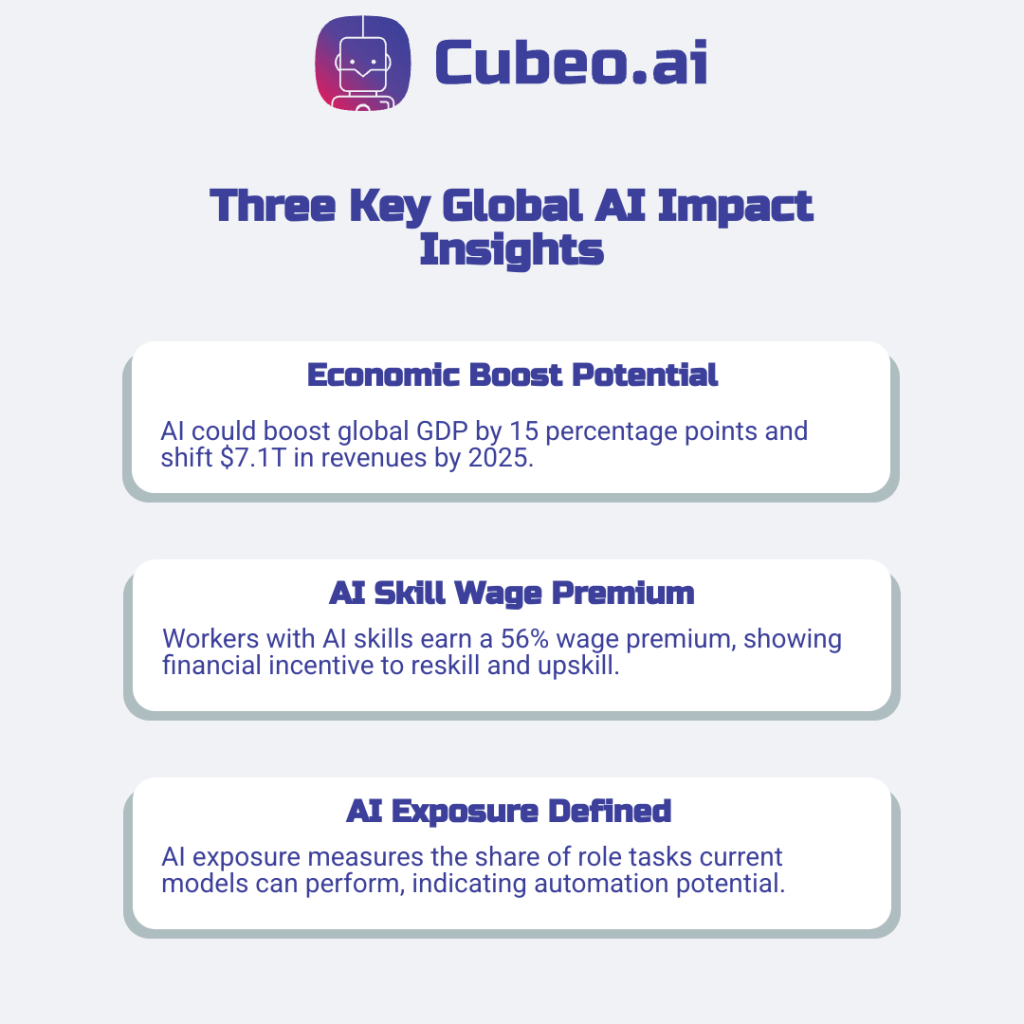
AI could boost global economic output by 15 percentage points over the next decade, with $7.1 trillion in revenues shifting between companies in 2025 alone, according to PwC research. Use these projections to justify pilot budgets and prioritize reskilling for roles where task exposure exceeds 40%.
Key workforce definitions for your planning:
AI Exposure = the percentage of job tasks current AI models can perform. Think of it as your role’s automation potential, not immediate job risk.
Displacement = specific tasks or positions eliminated by AI automation.
Augmentation = AI enhancing human capabilities rather than replacing workers entirely.
PwC’s analysis of nearly a billion job ads reveals the current landscape: 100% of industries are increasing AI usage, including traditionally low-tech sectors like mining and agriculture. Workers with AI skills earn a 56% wage premium (PwC 2025), while skills for AI-exposed jobs change 66% faster than other positions.
These baseline numbers set your framework for measuring displacement versus creation patterns in the next section.
Job Creation vs Displacement Numbers
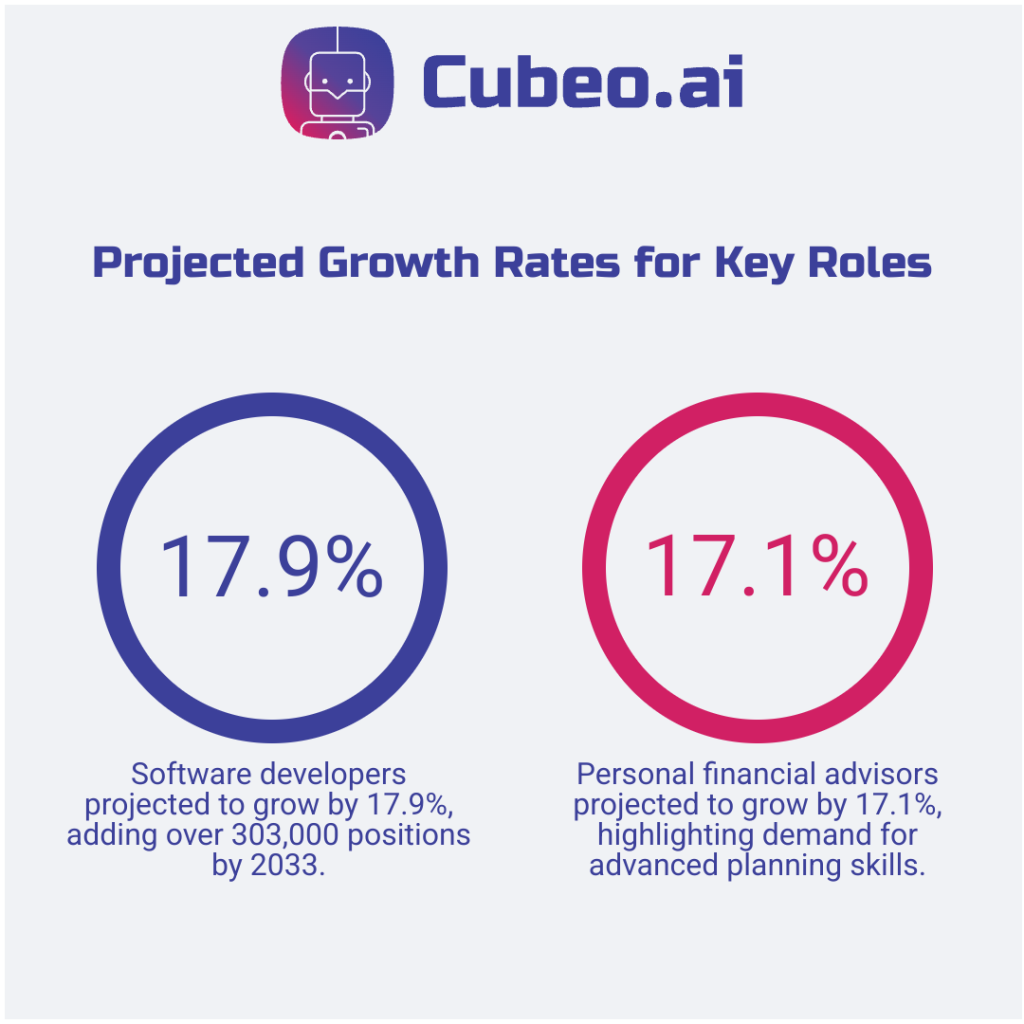
Official forecasts show net job growth across the economy alongside targeted declines in routine occupations. Bureau of Labor Statistics (BLS) projects software developers will grow 17.9%, adding 303,700 positions through 2033. Keep hiring and upskilling pipelines open for steady engineering demand.
Government methodology uses conservative assumptions about gradual adoption timelines. BLS analyzes which core tasks AI can replicate, then projects slower technological change than private forecasts suggest.
Industry-specific patterns for your planning:
- Database administrators +8.2% (BLS, Mar 2025).
- Personal financial advisors +17.1% (BLS, Mar 2025).
- Claims adjusters -4.4%; insurance appraisers -9.2% (BLS, Feb 2025).
- Architecture and engineering +6.8% overall (BLS, Feb 2025).
So what?
- Pilot AI agents for routine claims processing and reskill staff toward complex adjudication.
- Focus reskilling on relationship building and complex financial planning.
- Invest in data management training that combines AI tools with human oversight.
- AI assists design work rather than replacing designers.
AI Wage Premium and Productivity Gains
Your training budget justification starts with measurable outcomes. Revenue per employee in AI-exposed industries grew 3x faster than in least exposed sectors, with AI agents reducing operational times by up to 94% in documented cases.
Training investment gaps create opportunity: 70% of workers remain unprepared for AI driven changes, with over 90% lacking recent AI training. This skills shortage drives premium compensation for AI-capable employees across marketing, finance, and operations roles.
Real productivity examples: Our market research automation implementations demonstrate measurable efficiency gains through agent workflows. Organizations typically see positive ROI within their first quarter of targeted AI skill development.
Your budget calculation: For a $60,000 role, AI skills command significant premiums. Allocate $2,000-4,000 per employee for comprehensive AI training when task exposure exceeds 40%. Factor this against retention costs and competitive salary pressures.
Action step: Identify your top 3 roles with highest AI exposure. Pilot training programs there first, then scale based on measured productivity improvements.
These investment patterns vary significantly by specific occupations and demographic groups covered next.
Occupational and Demographic AI Exposure
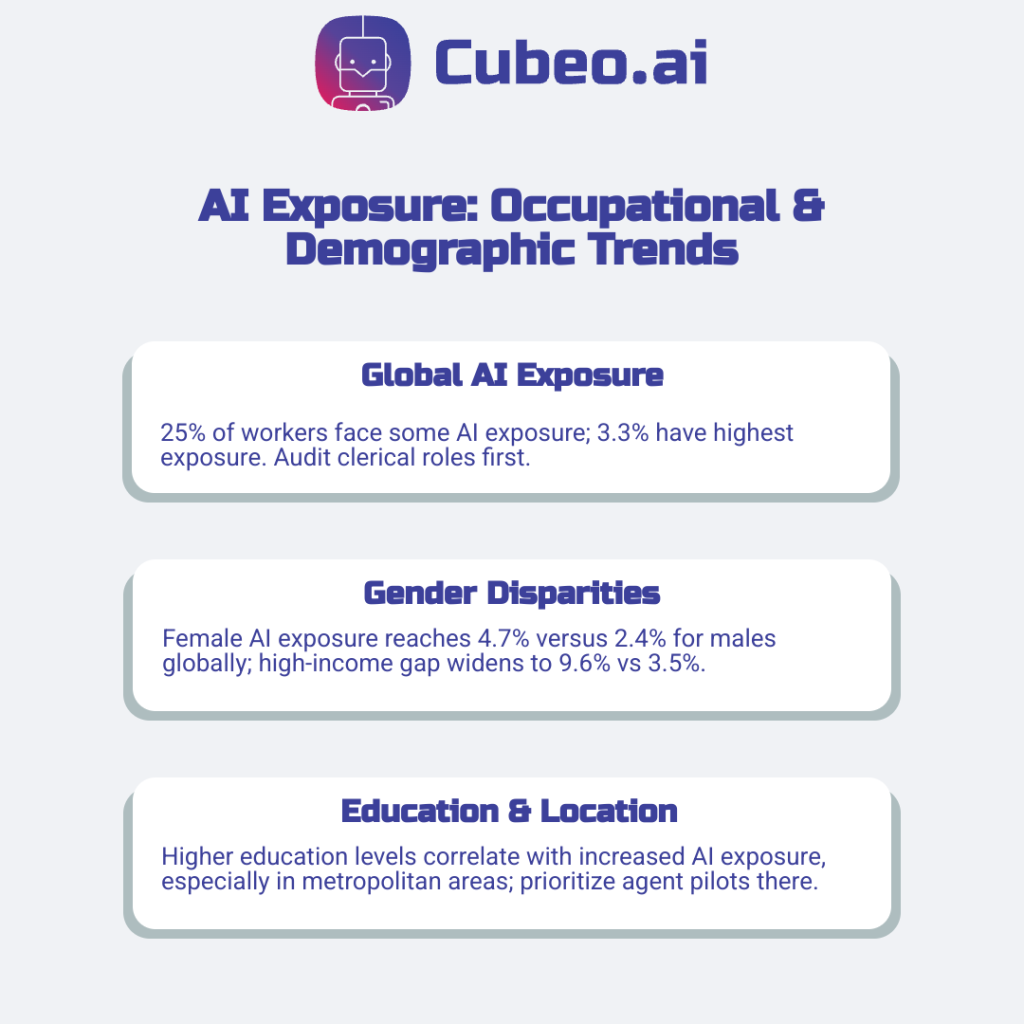
Workforce planning starts with who faces exposure. 1 in 4 workers globally have some AI exposure, with 3.3% in the highest category (ILO, May 2025). Audit clerical roles first since they concentrate the highest risk.
Gender gaps demand attention: Female exposure reaches 4.7% versus 2.4% for males globally. In high-income countries, this widens to 9.6% female versus 3.5% male (ILO, May 2025). Prioritize reskilling programs for women in administrative positions.
Age patterns show clear trends: Early-career workers aged 22-25 in highly exposed occupations declined 13% since late 2022, while older workers in identical roles grew 9%. Software developers aged 22-25 fell nearly 20% (Stanford, Aug 2025).Create targeted support programs for junior tech staff.
Education and location matter: Higher education levels correlate with increased exposure, particularly in urban knowledge work (Pew, Jul 2023). Focus agent pilots on metropolitan areas with educated workforces.
Use these exposure patterns to prioritize the agent workflow strategies covered next.
Turn These Statistics into AI Agent Workflows
Implementation urgency is clear: 85% of enterprises will implement AI agents by end of 2025, with the market reaching $7.6 billion. Companies expect 62% ROI or higher (Warmly, Aug 2025).
90-day pilot framework:
- Weeks 0-2: Scope (owner: HR lead) — select 1 high-exposure role, 2 repeatable tasks, capture baseline metrics
- Weeks 3-6: Configure agent, run internal testing
- Weeks 7-12: Live pilot with measurement
- Day 90: Scale, iterate, or stop decision
Budget allocation: Use wage premium data from our Global section to justify training investments. 79% of companies adopted AI agents, with 88% planning budget increases (PwC, May 2025).
Technical foundation: Implement RAG (retrieval-augmented generation) — a way to keep agent outputs tied to your live HR and ops data.
Success metrics with targets:
- Task automation: baseline → +15-30% (weekly check)
- Productivity gain: target 10-25% in 90 days (compare to 66% PwC benchmark)
- Employee satisfaction: baseline +5 points